Lorem ipsum dolor sit amet, consectetur adipiscing elit. Ut elit tellus, luctus nec ullamcorper mattis, pulvinar dapibus leo.

Lorem ipsum dolor sit amet, consectetur adipiscing elit. Ut elit tellus, luctus nec ullamcorper mattis, pulvinar dapibus leo.

Lorem ipsum dolor sit amet, consectetur adipiscing elit. Ut elit tellus, luctus nec ullamcorper mattis, pulvinar dapibus leo.

Lorem ipsum dolor sit amet, consectetur adipiscing elit. Ut elit tellus, luctus nec ullamcorper mattis, pulvinar dapibus leo.

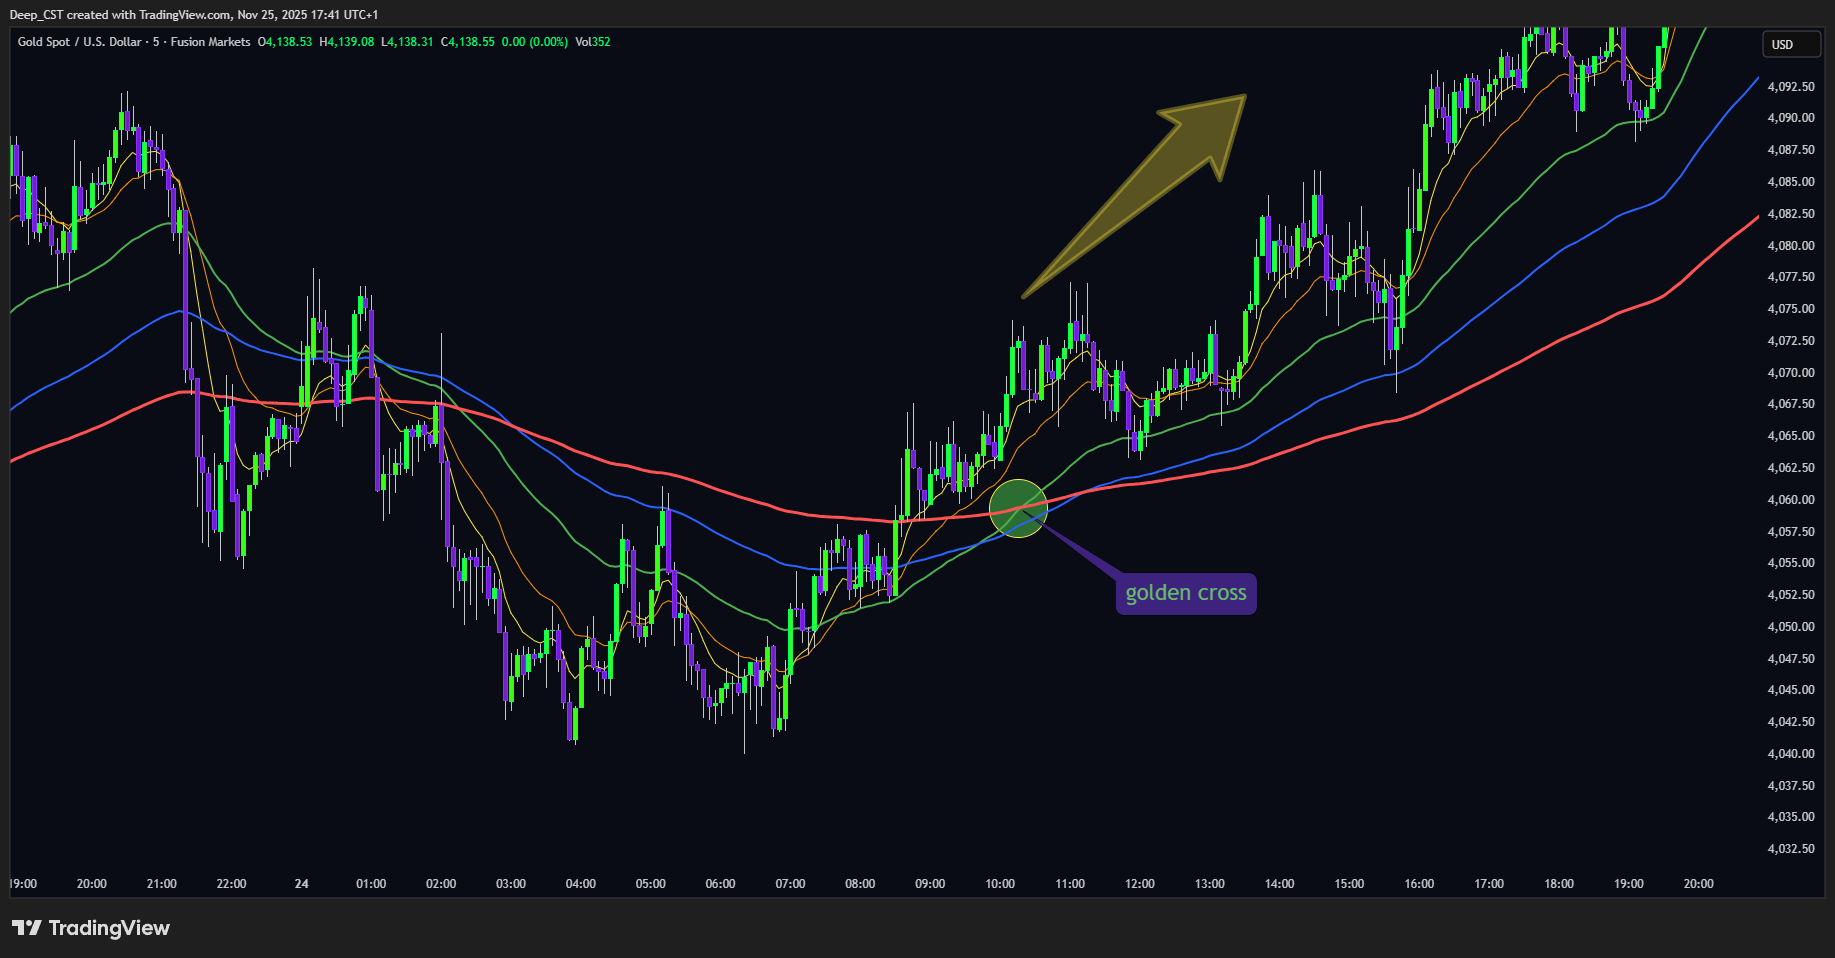
Capture massive market trends with the Turtle Swing Strategy.

This advanced TradingView indicator automates the classic trend-following method using EMA 100 & EMA 350 crossovers. Unlike basic indicators, it includes a built-in Smart ADX Filter to eliminate false signals during choppy, sideways markets.

Key Features:

  • 🚀 Clear Signals: Instantly spots Golden Cross (Long) and Dead Cross (Short) setups.
  • 🛡️ Fakeout Protection: ADX filter ensures you only trade when the trend is strong.
  • 🛑 Visual Risk Management: Auto-draws precise Stop Loss lines based on price structure.
  • 📊 Live Dashboard: Displays real-time trend strength directly on your chart.
  • Best for: Swing Trading on 4H and Daily timeframes (Crypto, Forex, Indices).

Turtle Swing Strategy Tutorial

$0.00

🐢 Turtle Trend-Following Strategy (EMA + ADX)

Strategy Type: Trend Following / Swing Trading
Recommended Timeframes: 4H (4-Hour) or 1D (Daily)
Assets: Forex, Crypto, Commodities (Gold, Oil), Indices (S&P 500)

1. Indicators Setup

  • EMA 100: Color Green (Fast Moving Average)
  • EMA 350: Color Red (Slow Moving Average)
  • ADX (14): Threshold set to 20 (Trend Strength Filter)

2. LONG Entry Rules (Buy)

  1. The Crossover: Wait for the Green EMA (100) to cross ABOVE the Red EMA (350).
  2. The Filter: Check the dashboard or label. The ADX must be greater than 20.
  3. Confirmation: Wait for the signal candle to CLOSE. Do not enter while the candle is still moving.
  4. Action: Open a BUY position at the open of the next candle.
  • Stop Loss (SL): Set exactly at the LOW of the signal candle (the candle where the cross happened).
  • Take Profit (TP): Ride the trend. Close the position only when a Dead Cross (opposite signal) occurs.

3. SHORT Entry Rules (Sell)

  1. The Crossover: Wait for the Green EMA (100) to cross BELOW the Red EMA (350).
  2. The Filter: Check the dashboard or label. The ADX must be greater than 20.
  3. Confirmation: Wait for the signal candle to CLOSE.
  4. Action: Open a SELL position at the open of the next candle.
  • Stop Loss (SL): Set exactly at the HIGH of the signal candle.
  • Take Profit (TP): Ride the trend. Close the position only when a Golden Cross (opposite signal) occurs.

4. Important Tips for 4H/1D

  • Patience is Key: On the 1D timeframe, signals are rare but powerful. Do not force trades if the ADX is below 20 (grey background on the panel).
  • Position Sizing: Since the Stop Loss is based on the candle’s High/Low, the distance in pips/points can be large on the Daily chart. Adjust your lot size so that you never risk more than 1-2% of your account on a single trade.
  • Ignore the Noise: If the market is moving sideways and the EMAs are flat, the ADX filter will save you from losses. Trust the filter.
Subscribe to Our Newsletter
Stay updated with the latest trading insights and exclusive offers.

© 2025 Luminova Ventures Limited. All rights reserved.