📈 Luminova – Buffett Strategy (Invite‑Only)

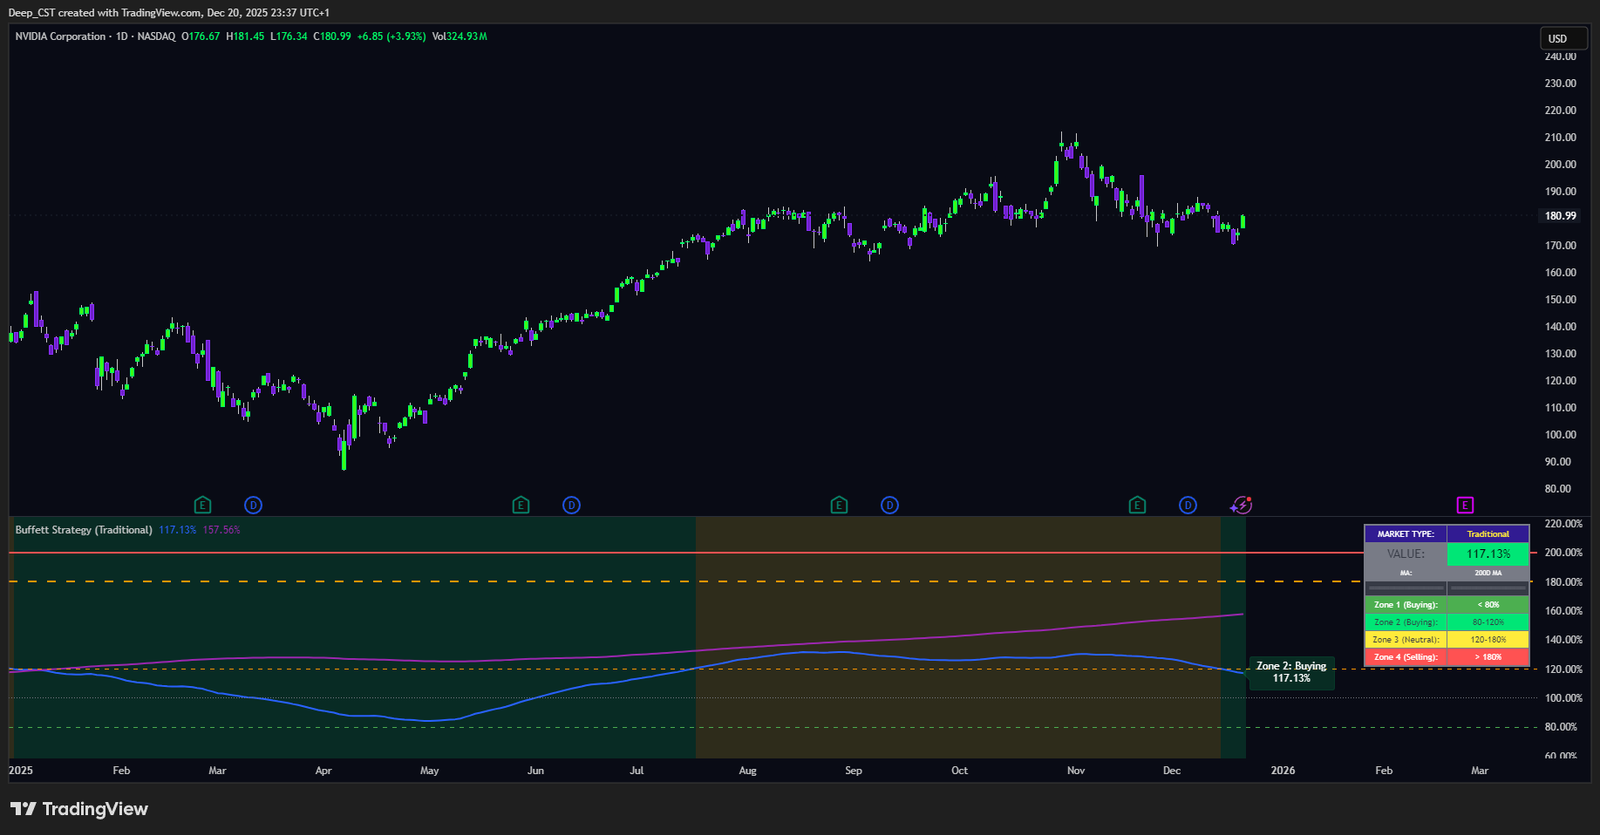
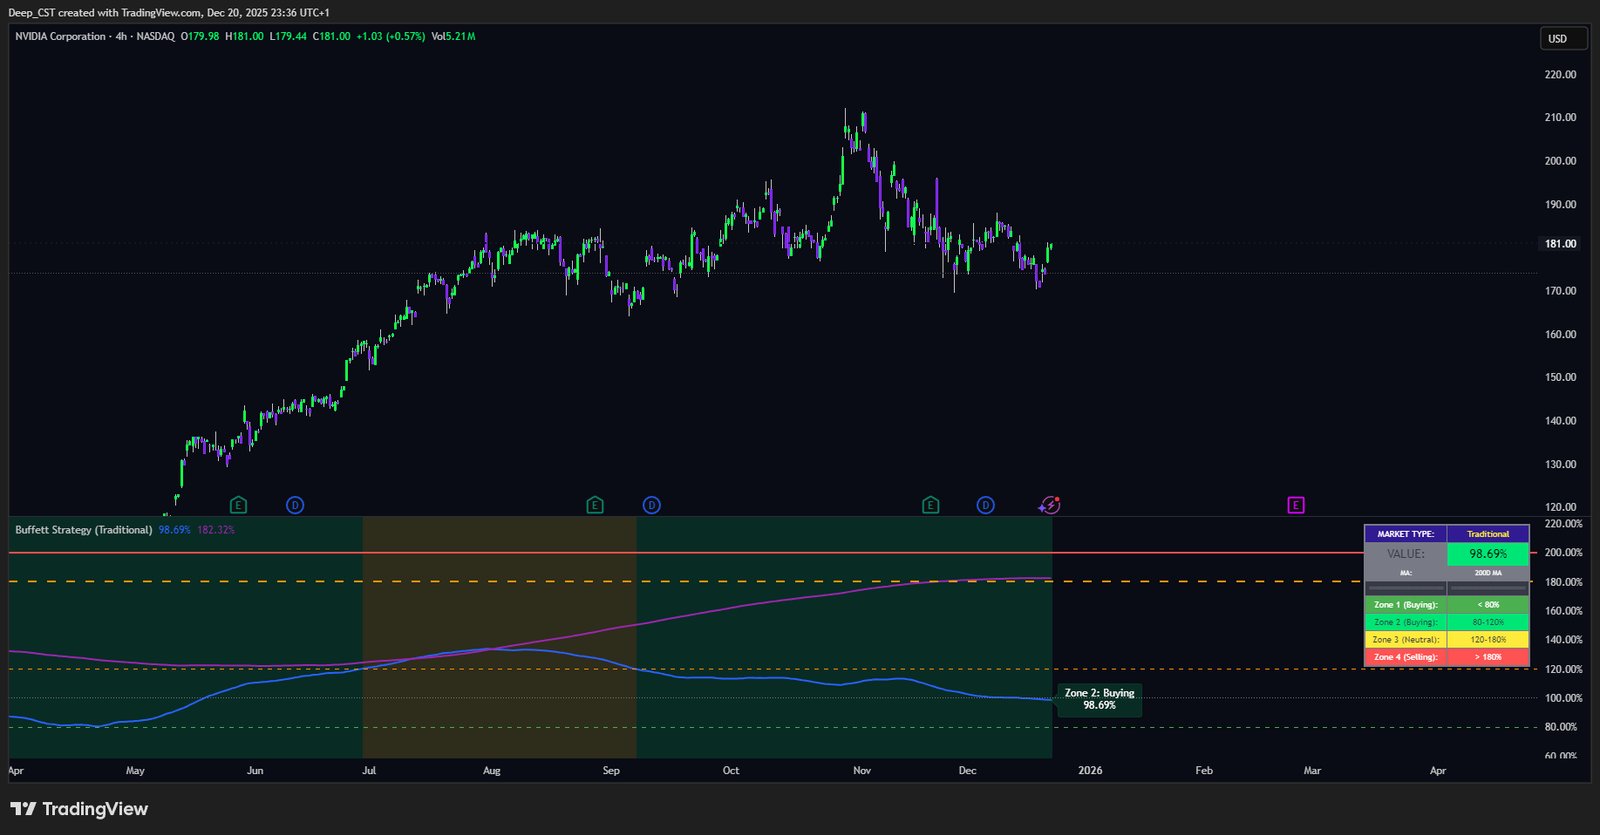
Luminova – Buffett Strategy is an invite‑only long‑term valuation indicator that brings Warren Buffett’s market‑cap‑to‑GDP philosophy directly into your charts. It compares price to a long‑term moving average and paints four clear zones – from Very Attractive Buying to Dangerous – you’re playing with fire – so you instantly see whether the market is historically cheap, fairly valued, or euphoric on both traditional assets and Bitcoin‑style crypto cycles.

$39.00

📈 Luminova – Buffett Strategy (Traditional & Crypto)

Strategy Type: Long‑Term Valuation / Position Investing
Recommended Timeframes: 1D (Daily), 1W (Weekly, if enough history)
Assets: Indices & Stocks (S&P 500, blue chips), Bitcoin & major Crypto assets

1. Core Concept – Buffett‑Style Valuation Zones

  • The indicator compares Price vs. a long‑term Moving Average and expresses it as a percentage around a 100% “fair value” baseline.
  • The value is mapped into 4 valuation zones inspired by Warren Buffett’s market‑cap‑to‑GDP logic: from deep undervaluation to dangerous overvaluation.
  • One script, two market profiles: Traditional mode for indices/stocks and Crypto mode for Bitcoin‑style cycles.

2. Modes: Traditional vs Crypto

  • Traditional Mode: Uses a 200‑day MA as the Buffett baseline, mirroring how long‑term investors view market valuation on indices and large‑cap equities.
  • Crypto Mode: Uses a 1400‑period MA on 1D (≈ 200‑Week MA), a well‑known anchor for Bitcoin bear‑market bottoms and cycle structure.
  • Switching the Market Mode input automatically updates: MA length, smoothing and zone thresholds, so you do not have to retune the script every time.

3. Valuation Zones & Interpretation

  • Zone 1 – Very Attractive Buying: Price trades well below the Buffett MA. Historically associated with panic, deep discounts and long‑term accumulation opportunities.
  • Zone 2 – Buying Zone: Reasonable or slightly discounted valuation. Suitable for scaling into long‑term positions with a margin of safety.
  • Zone 3 – Neutral / Caution: Elevated valuation. Favour selectivity, partial profit‑taking and stricter risk management.
  • Zone 4 – Dangerous / Consider Selling: Strong overvaluation. Market is stretched far above trend – ideal area to de‑risk, trim exposure or lock in profits.

4. Visual & Alert Features

  • Buffett Indicator Line: Smooth valuation curve showing how far above/below long‑term trend the market is over time.
  • Buffett MA Overlay: Optional Moving Average (purple for Traditional, orange for Crypto) to visually anchor price relative to its long‑term fair value.
  • Coloured Zones: Background shading (green → yellow → red) instantly shows in which valuation regime the market currently sits.
  • Info Panel: Compact table displaying market mode, current % value, MA type (200D or 200W proxy) and exact boundaries for Zones 1–4.
  • Alerts: Signals when price enters buying zones, returns to neutral or moves into the dangerous zone, plus a special alert when crypto reclaims the 200‑Week MA.

5. How to Use It in Your Portfolio

  • Use Zone 1 & 2 to build or add to long‑term positions when markets are fearful and pricing is below long‑term value.
  • Use Zone 3 & 4 to reduce exposure, hedge or rebalance when markets become euphoric and stretched vs. their Buffett baseline.
  • Combine the indicator with your own fundamental, macro or trend frameworks – treat it as a strategic timing and risk‑context layer, not as a standalone trade trigger.

Powered by Luminova Ventures · Quantitative tools for long‑term investors

Subscribe to Our Newsletter
Stay updated with the latest trading insights and exclusive offers.

© 2026 Luminova Ventures Limited. All rights reserved.