
AI Analytics Dashboard transforms raw business data into real-time insights by combining artificial intelligence, APIs and automated reporting. Instead of manually collecting information from multiple systems, businesses gain a centralized dashboard that continuously updates key performance indicators and highlights important trends.
In 30 Seconds
- AI Analytics Dashboards combine data from multiple business systems.
- Artificial intelligence identifies trends and anomalies automatically.
- Real-time reporting replaces manual spreadsheets.
- Companies make faster decisions using accurate business data.
What Is an AI Analytics Dashboard?
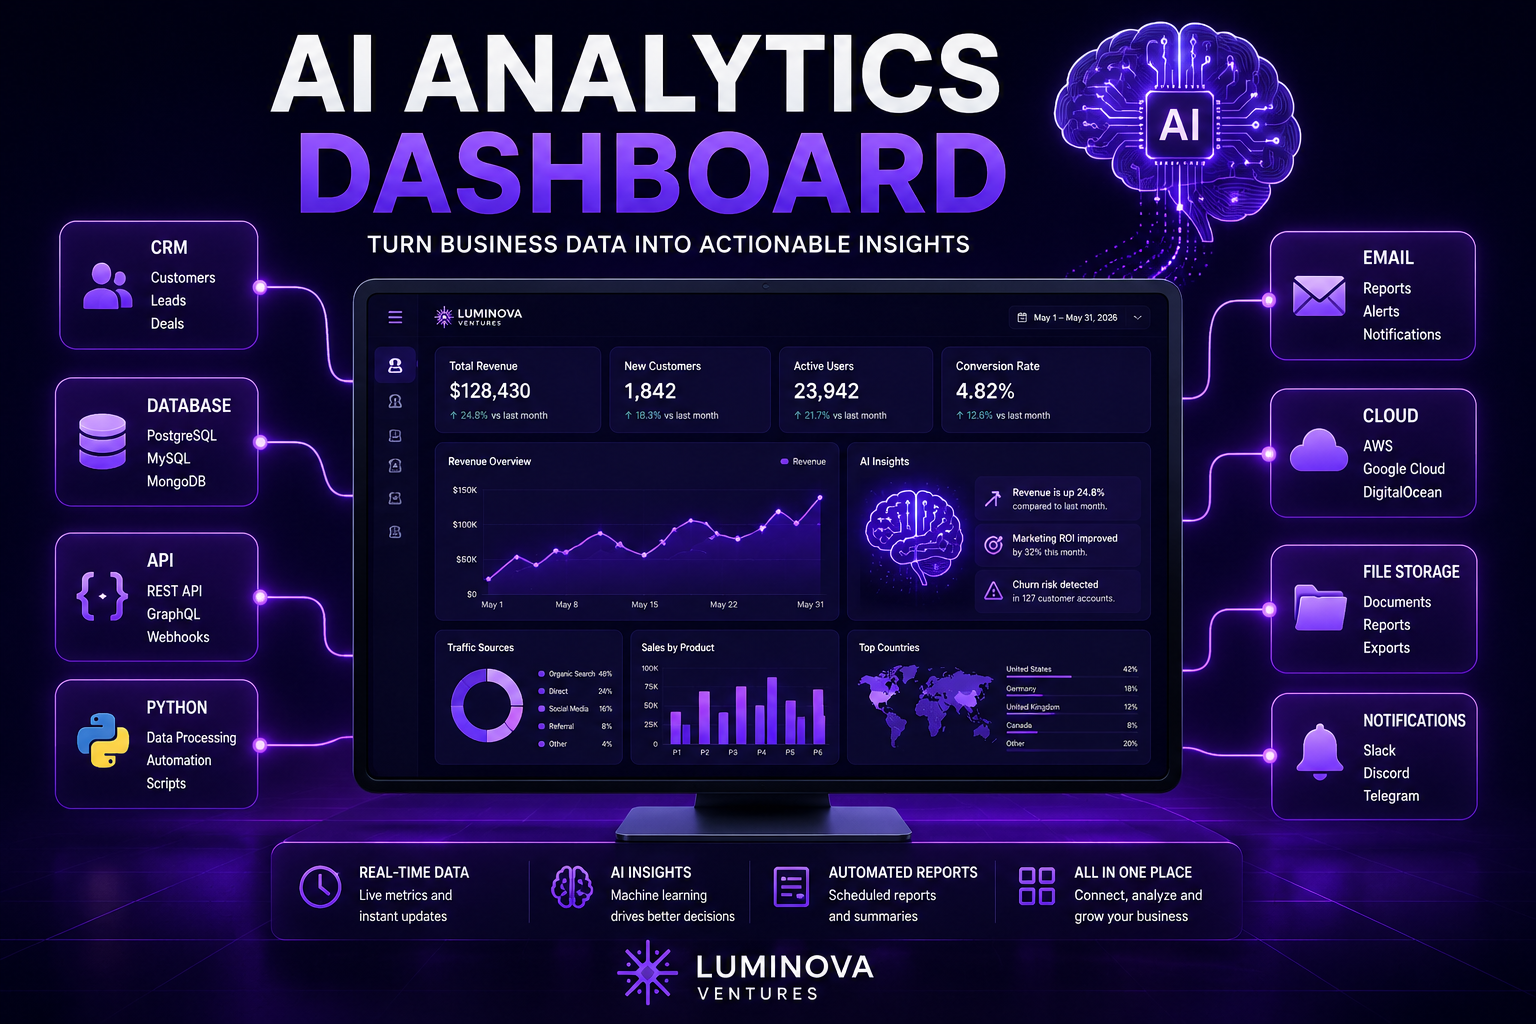
An AI Analytics Dashboard is a centralized platform that collects data from multiple business systems, analyzes it using artificial intelligence and presents the results through interactive dashboards. Instead of opening several applications to understand business performance, decision-makers receive one real-time overview of their operations.
Modern dashboards connect CRM platforms, databases, APIs, accounting software, marketing tools and internal applications into one reporting environment. AI continuously analyzes incoming information to identify trends, anomalies and opportunities that may otherwise remain unnoticed.
Unlike traditional reporting, which often depends on manually prepared spreadsheets, AI Analytics Dashboards update automatically and provide reliable business intelligence throughout the day.
Why Businesses Use AI Analytics Dashboards
Growing businesses generate more operational data every month. Sales, customer support, finance, marketing and production all produce valuable information, but it is usually scattered across different software platforms.
An AI Analytics Dashboard brings these data sources together, allowing managers to monitor company performance, measure KPIs and react to operational changes much faster.
Real-Time Insights
Business metrics update automatically without waiting for manual reports.
AI-Powered Analysis
Artificial intelligence identifies unusual patterns, risks and opportunities.
Centralized Reporting
Combine CRM, ERP, databases and cloud applications into one dashboard.
Better Decisions
Reliable business intelligence supports faster and more confident decision-making.
What Can an AI Analytics Dashboard Monitor?
AI Analytics Dashboards can visualize almost every business metric that matters. Instead of checking different systems separately, companies receive one complete operational overview.
- Sales performance
- Customer acquisition
- Marketing campaigns
- Operational KPIs
- Financial reporting
- Website analytics
- Support performance
- Workflow execution
- API performance
- Business growth metrics
Typical AI Analytics Dashboard Workflow
- Business systems continuously generate operational data.
- APIs collect information from multiple platforms.
- Databases organize incoming records.
- Artificial intelligence analyzes the data.
- Dashboards update KPIs automatically.
- Managers receive alerts when unusual events occur.
- Business decisions are based on real-time information.
AI Analytics Dashboard vs Traditional Reporting
Traditional reporting often requires employees to export spreadsheets, combine multiple reports and manually calculate business metrics. This process is slow and increases the likelihood of errors.
An AI Analytics Dashboard automates reporting, ensuring that decision-makers always have access to current, accurate and actionable business information.
Traditional Reporting vs AI Analytics Dashboard
Traditional Reporting
- Manual spreadsheet preparation
- Delayed information
- Higher risk of errors
- Multiple disconnected reports
- Limited scalability
AI Analytics Dashboard
- Automatic reporting
- Real-time KPIs
- AI-powered insights
- One centralized dashboard
- Scalable business intelligence
Technologies Behind AI Analytics Dashboards
Modern AI Analytics Dashboards combine APIs, databases, Python automation, cloud infrastructure and artificial intelligence into one business intelligence platform that continuously analyzes operational performance.
When Should a Business Build an AI Analytics Dashboard?
An AI Analytics Dashboard becomes valuable when decision-makers spend too much time gathering reports instead of acting on them. If business data is spread across multiple platforms, employees often waste hours exporting spreadsheets and comparing numbers manually.
By centralizing operational data into one intelligent dashboard, companies gain instant visibility into performance while reducing reporting time and improving decision quality.
- Sales data comes from multiple systems.
- Marketing reports require manual preparation.
- KPIs are updated only once per week.
- Management needs real-time visibility.
- Teams use disconnected spreadsheets.
- Business performance is difficult to monitor.
- Operational decisions depend on outdated reports.
- Departments work with different versions of the same data.
AI Analytics Dashboard and Artificial Intelligence
Artificial intelligence turns dashboards into decision-support systems rather than simple reporting tools. AI can detect anomalies, identify growth opportunities, forecast trends and automatically summarize business performance before managers even review the data.
Instead of manually searching through charts, decision-makers receive intelligent recommendations supported by continuously updated business information.
Modern AI platforms such as OpenAI allow organizations to integrate natural language analysis, forecasting and intelligent reporting directly into their analytics dashboards.
How Luminova Ventures Builds AI Analytics Dashboards
Luminova Ventures develops AI Analytics Dashboards that combine business intelligence, workflow automation and AI into one reporting platform. Instead of replacing existing software, dashboards connect current systems through APIs and automate data collection across the organization.
Every dashboard is designed around measurable business objectives, helping companies monitor operations, improve reporting accuracy and make faster decisions using real-time information.
- Workflow Automation Explained
- Business Process Automation
- Python Infrastructure Automation
- AI Business Assistant
- Free Automation Audit
Frequently Asked Questions About AI Analytics Dashboards
What is an AI Analytics Dashboard?
An AI Analytics Dashboard is a centralized reporting platform that combines business data, APIs and artificial intelligence to provide real-time insights and support better decision-making.
How is an AI Analytics Dashboard different from traditional dashboards?
Traditional dashboards display historical data, while AI Analytics Dashboards automatically analyze information, identify trends, detect anomalies and generate intelligent recommendations.
Which business data can an AI Analytics Dashboard monitor?
Dashboards can monitor sales, marketing, finance, CRM activity, customer support, operational KPIs, workflow execution, API performance and many other business metrics.
Can an AI Analytics Dashboard integrate with existing software?
Yes. Modern dashboards connect with CRMs, databases, ERP systems, APIs, cloud services and internal applications without replacing the company’s existing technology stack.
Turn Your Business Data Into Actionable Insights
Request a free Automation Audit and discover how an AI Analytics Dashboard can centralize reporting, automate business intelligence and improve decision-making.
Request Free Automation AuditLooking for more practical AI, automation and software development resources?
← Back to Knowledge Base